Relative Strength Index, commonly known as just "RSI", is first explained by J. Welles Wilder in his 1978 book "New Concepts in Technical Trading Systems". It is an oscillator, meaning it oscillates between two fixed values based on price or index movements. It is a "leading" indicator, meaning it actually predicts price tops and bottoms BEFORE they actually occur. The name is a bit of a misnomer. It is measuring strength relative to ITSELF, not to something else.
RSI has one "setting", the "period" to use. Mr. Wilder used 14, so 14 is the default in most RSI charts. However, 9 and 25 are also used. So how do you calculate RSI? First you need to calculate the RS for the period in question.
RS = average price change on up days + average price change on down days
Then you use that to calculate the RSI
RSI = 100 - (100 + (1 + RS))
RSI has a range of 0 to 100, and most of the time it moves between 30 and 70, unless a MAJOR trend push it outside those boundaries. Consider 30/70 to be the oversold / overbought boundaries, though 20/80 seems to be used more often nowadays. The high number is overbought: too many people bought the stuff and the price can't go up any more. The low number is the opposite: oversold. The prices are so low nobody will be selling much soon, and the prices are about to hit bottom. Keep in mind that these top and bottom boundaries are NOT fixed in stone.
How *do* you use the line as a signal? There are two camps about this: 1) when line go ABOVE the high line, sell. When line go BELOW the low line, buy. This anticipates the trend, but it may get you out of the up trend a little earlier than the peak, and it may get you buy in a little earlier than the true bottom. 2) when line comes back below the high line, sell. When line comes back above the low line, buy. This follows the trend, so you will not at the peak, but past it. You are really using it as a trend-follower instead of trend-leader.
Keep in mind that a shorter range RSI would have sharper and more pronounced peaks than mid- or long-range RSIs. If the market is trending, and your RSI lines are not moving far enough, you may want to chart one with a shorter period and see if that is giving you signals that way. On the other hand, if the market is really volatile and making a lot of ups and downs, and RSI is going up and down like crazy, then you may want to switch to a longer period to "calm it down".
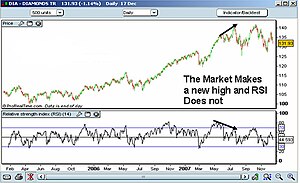
An important thing to check is "divergeance". In this case, you need to compare the RSI chart against the price chart. If the price chart is heading upwards, but the RSI chart is heading downwards. Look for a series of peaks getting higher and higher, while RSI peaks are getting lower and lower, or vice versa: price bottoms making lower lows, while RSI bottom gets higher and higher. Eventually the divergeance will disappear, and RSI will start following the price (or vice versa), but that divergeance is VERY significant event.
The problem with RSI is that it is NOT that useful in trending markets, as the RSI will consistently be too high or too low, so it cannot generate any proper signals, and remain there for a LONG time.
So to summarize... RSI measures strength against itself, and indicates overbought/oversold conditions. however, it is mainly useful in a trading market (i.e. going "sideways"). You can use the "period" of the RSI to act as a smoothing filter. The longer the period, the smoother the curve. If the RSI line is not giving any signals, shorten the period. If the RSI line is giving too many signals, lengthen the period. Default RSI period is 14, though 9 and 21 are also used. Use it to confirm other signals, and watch for divergence as that really confirm the signal.
The Relative Strength Index (RSI) Primer
About GuyReviews
Soratemplates is a blogger resources site is a provider of high quality blogger template with premium looking layout and robust design
Technical analysis
Labels:
Stocks and Bonds,
Technical analysis


![Reblog this post [with Zemanta]](http://img.zemanta.com/reblog_e.png?x-id=3b48e301-341b-4bfa-9a7c-f0d2e285ed88)